

26 Aug, 2026/ by National Accident Helpline /News
Once associated with farming and country homes, the SUV has since evolved to become the premier choice for many Brits, including families and status-chasers alike. So much so, since the rise of the SUV, the cars have been coined the ‘Chelsea tractor' and now fills roads in the countryside, suburban areas, and even cities.
SUVs have grown in such popularity that they're commonly replacing many of the hatchbacks and saloons that once dominated Britain's driveways. As SUV popularity grows, so does the debate around SUV dangers and what this shift means for pedestrians, cyclists and other vulnerable road users.
To better understand the trend, National Accident Helpline has surveyed 1,000 Brits and spoken to industry experts to understand why SUVs are becoming so popular in the UK, how the public feel about this boom, as well as whether SUVs could pose additional risks to pedestrians and vulnerable road users.
Key findings at a glance:
- 33% would choose an SUV if money was no object
- Popular cars are 26.2% larger than they were in 2001
- 81% have noticed more SUVs on UK roads
- 45% think larger vehicles are less safe for pedestrians
- Nearly a quarter of National Accident Helpline road traffic accident enquiries involve pedestrians and cyclists
Britain's love for the SUV
SUVs are everywhere and people are noticing. Of those surveyed, four in five (81%) say they've noticed more SUVs on the roads over the past decade.
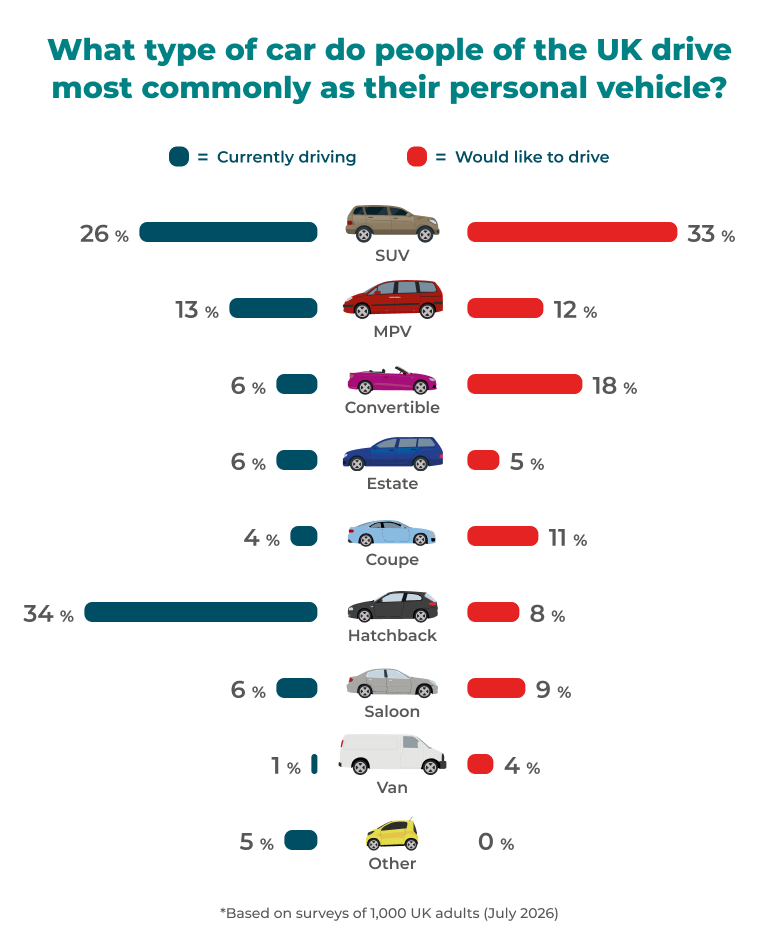
Once seen primarily as specialist off-road vehicles, SUVs have firmly moved into the mainstream. While hatchbacks remain the UK's most commonly owned car, SUVs are now the most desirable, with one in three (33%) saying they would choose an SUV if money were no object. That puts them ahead of traditional status-symbol cars such as convertibles and coupes.
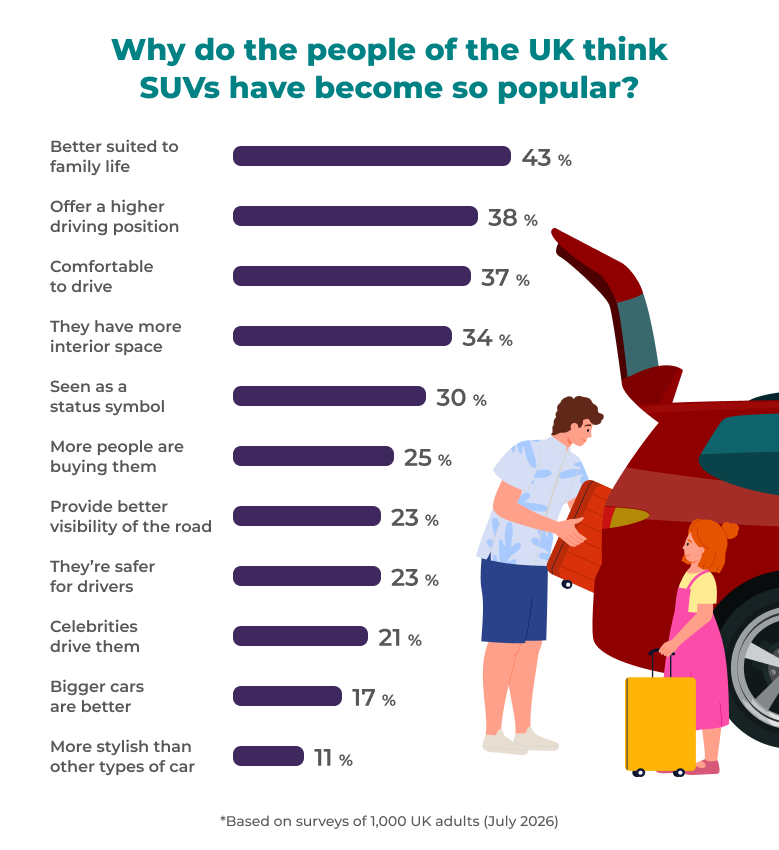
So, what's behind the SUV boom? It seems practicality is winning out over prestige. The most popular reason for choosing an SUV is that they're better suited to family life, followed by their higher driving position, comfort and extra interior space.
However, status still plays a part. Almost a third (30%) believe SUVs have become a status symbol, suggesting their appeal is about more than simply getting from A to B.
The average new car is now 26% larger than it was in 2001
The average size of the most popular cars on UK roads has increased significantly since 2001 with their overall size growing by 26.2% and their road footprint growing by 13.7% between 2001 and 2025.
Using Department for Transport and DVLA registration data, we explored the UK's top ten best-selling new vehicles each year and mapped their dimensions to track how the average size of the country's most popular cars has changed.
Between 2001 and 2025:
- Average vehicle length increased from 4,095mm to 4,332mm, a rise of 237mm (5.8%).
- Average vehicle width grew from 1,692mm to 1,820mm, up 127mm (7.6%).
- Average vehicle height increased from 1,417mm to 1,572mm, an increase of 155mm (10.9%).
Iconic SUVs are also ballooning
The trend becomes even more noticeable when looking at some of the UK's most popular SUVs, with every model in our sample growing substantially between its earliest comparable generation and its latest model available in 2025.
Across the six models analysed, today's SUVs are longer, wider and generally take up considerably more space on the road than their predecessors.
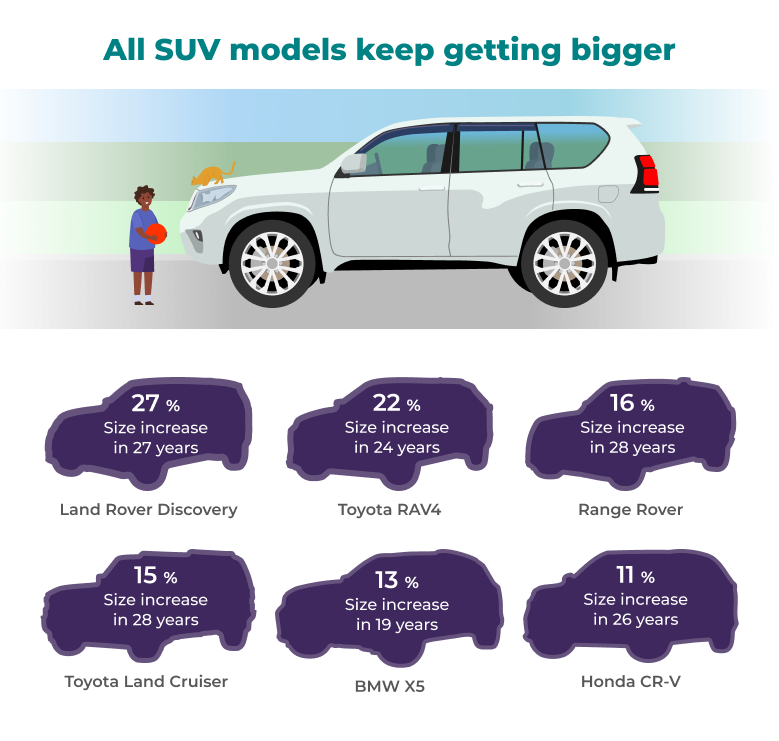
The biggest growth was recorded by the Land Rover Discovery, which has increased by 449mm in length and 280mm in width since the original Discovery I launched in 1990. While the latest model is slightly lower than the original vehicle, its overall road footprint has grown by 27.1%, while its total vehicle volume has increased by 21.7%.
The Toyota RAV4, credited as the world's first urban SUV, has experienced similar expansion. Compared with the first-generation model launched in 1995, today's RAV4 is 485mm longer, 160mm wider and has seen its overall volume increase by 24.2%.
Luxury SUVs have also become considerably larger. The latest Range Rover is 339mm longer and 150mm wider than the 1994 model, with overall vehicle volume increasing by 19.2%. The latest model now measures more than five metres in length.
| SUV Model | First generation | Most recent | Footprint growth percentage (L x W) | Volume growth percentage (L x W x H) | ||||
|---|---|---|---|---|---|---|---|---|
| Length (mm) | Width (mm) | Height (mm) | Length (mm) | Width (mm) | Height (mm) | |||
| Land Rover Discovery | 4521 | 1793 | 1928 | 4970 | 2073 | 1846 | 27.1% | 21.7% |
| Toyota RAV 4 | 4115 | 1695 | 1660 | 4600 | 1855 | 1685 | 22.3% | 24.2% |
| Range Rover | 4713 | 1853 | 1818 | 5052 | 2003 | 1870 | 15.9% | 19.2% |
| Toyota Land Cruiser | 4675 | 1820 | 1880 | 4925 | 1980 | 1935 | 14.6% | 18.0% |
| BMW X5 | 4667 | 1872 | 1707 | 4922 | 2004 | 1745 | 12.9% | 15.4% |
| Honda CR-V | 4520 | 1750 | 1675 | 4706 | 1866 | 1684 | 11.0% | 11.6% |
As larger vehicles become increasingly common on UK roads, concerns around visibility, manoeuvrability and the safety of pedestrians, cyclists and other vulnerable road users are becoming a growing part of the conversation surrounding Britain's changing vehicles.
Britain's SUV safety dilemma
Brits seem to have a love-hate relationship with the SUV. According to our research, while people see larger cars as being safer for them inside, they are concerned about the risks they may pose to the people outside of a car, with 45% of people admitting that they think SUVs are less safe on the roads for pedestrians and vulnerable road users.
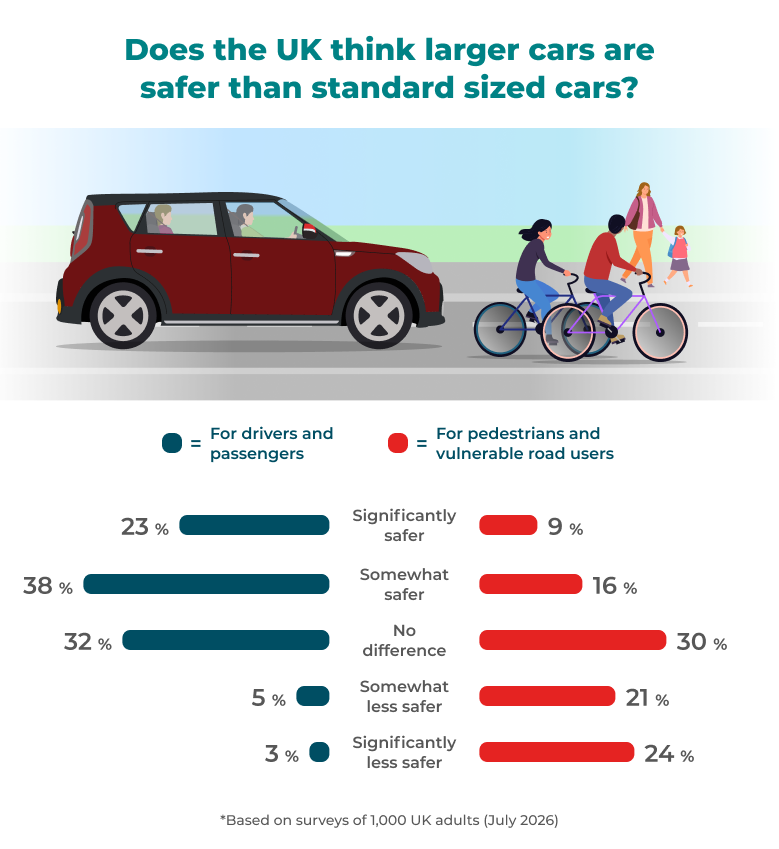
When it comes to choosing a new car, price and value for money come out on top, with three-quarters (75%) saying these were among the most important considerations when buying a new car. While 64% prioritised fuel efficiency and running costs, safety ranked third with 57%.
Women were significantly more likely to prioritise safety with nearly two-thirds (62%) of women citing it as a key purchasing consideration, compared to only 51% of men.
Despite this, only half (49%) said they would reconsider buying a car if they found out it poses a greater risk for pedestrians and vulnerable road users.
Are SUVs more dangerous?
As SUVs become larger and more popular, one question has become increasingly difficult to ignore: do bigger cars pose greater risks to pedestrians and other vulnerable road users?
We spoke to experts from two leading European organisations Transport & Environment and vehicle safety organisation Euro NCAP - to explore how vehicle size, design and technology can affect road safety.
The rise of ‘car-spreading'
“Car-spreading is the phenomenon where we see cars getting bigger and bigger every single year,” says Eloise Sacares, Senior Vehicles Policy Researcher at the NGO Transport & Environment (T&E).
“This has impacts on pedestrian safety due to the outsized impact of SUVs on pedestrian and cyclist fatalities when they're involved in a collision, but also on road damage and oil consumption and other societal impacts.”
“A lot of people don't realise how dangerous SUVs are to other pedestrians. They're sold SUVs as being safer for you. I think if people were more aware of the impacts that it has on pedestrians, cyclists and other road users, then [sales of SUVs] might go down.”
Visibility, blind spots, and vulnerable road users
One of T&E's biggest concerns is visibility, particularly when it comes to children and vulnerable road users. Sacares explains that the higher driving position and taller front end of some SUVs can create blind spots directly in front of the vehicle.
“A VW Golf can easily see a child that's around four years old, but a Land Rover Defender can't. The average height of a 4.5-year-old child is 1.1 metres, and the driving position of a Land Rover Defender means they can't see beyond that height.
“If you think about adults who may have disabilities that mean that they are at a lower height, such as dwarfism, but also wheelchair users, then that's posing a real danger to a lot of road users.”
The wider impacts of growing vehicles
While collisions can have devastating effects on individuals, the danger that concerns groups like T&E is the wider trends we can expect, as increased SUV numbers on roads lead to increased road traffic accidents.
Sacares states: “If we continue on this trajectory, there would be an additional 2,500 deaths of vulnerable road users by 2040 [across Europe]. People are sold the personal benefits, but there is a lack of awareness of the societal impacts.”
The human cost of increased road-traffic accidents
National Accident Helpline's own data highlights the real-world impact road traffic accidents have on pedestrians, cyclists and other vulnerable road users.
Since 2025, we've assessed 7,736 enquiries relating to road traffic accidents, with more than 2,500 coming from the first half of 2026 alone. Pedestrian and cyclist accident claims account for almost a quarter (24%) of all road traffic accident enquiries we process.
If you've been injured by a driver, you can speak to our dedicated team who will listen to your situation and help assess whether we could help you earn the compensation you deserve.
You can also read our road traffic accident claims page to find out more about how National Accident Helpline could help you.
Methodology
Average car size analysis (2001-2025)
Department for Transport (DfT) and Driver and Vehicle Licensing Agency (DVLA) registration data was analysed to find the ten best-selling new car models in each year between 2001 and 2025.
Average vehicle length, width and height were calculated annually using manufacturer specification data and generation-level vehicle dimensions. Where a model changed generation during a year, a representative generation was selected based on registration volumes and model availability.
Road footprint growth was measured using a vehicle's bounding rectangle (length × width), while overall vehicle growth was measured using total vehicle volume (length × width × height).
SUV growth analysis
Manufacturer dimensions were collected for each vehicle generation, including length, width and height. Growth was then measured in both absolute terms (millimetres) and relative terms (percentage increase).
Road-space growth was calculated using the vehicle's road footprint (length × width), while overall size growth was calculated using total vehicle volume (length × width × height).
Where historic manufacturer materials used different width measurement conventions, dimensions were cross-referenced using historical technical archives and manufacturer specification data to ensure consistency wherever possible. Full generation-by-generation measurements and source materials were compiled and reviewed for quality assurance prior to analysis.
Survey data
National Accident Helpline surveyed 1,000 UK adults via One Pulse in July 2026.